Here we go with the latest installment of my long-running Voter Registration Maps series. These statistics are from the annual January 15th report from the State Election Board.
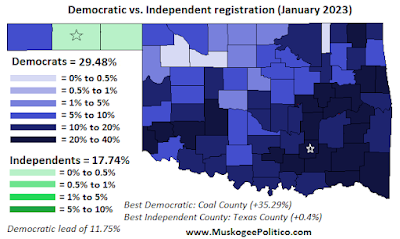
In this post, I have graphics showing registration leader by county, majority/plurality by county, registration swing by county, growth by county for all parties and for Independents, and a comparison of Democrats versus Independents by county (a new addition to my map collection). Take a look, and share with your friends:
You can click each image to view it larger.
The lone county with a Democratic voter registration lead is Coal County (4.16% lead). In January 2020, Democrats held majority status in 14 counties. Since last January, the GOP has taken the lead in six counties: Cherokee County (0.06% lead), Harmon County (8.75% lead), Latimer County (5.52% lead), McIntosh County (2.51% lead), Muskogee County (7.33% lead), and Pushmataha County (12.79% lead).
Major County has the widest gap, with 79.91% Republicans and 9.71% Democrats (a distance of 70.19%). Statewide, 51.88% of voters are Republicans and 29.48% are Democrats, a gap of 22.4%.
Independents comprise 17.74% of all registered voters, and rank over 20% in three counties: Cleveland (20.44%), Comanche (22.51%), and Oklahoma (21.12%). Libertarians are now 0.898% statewide, and over 1% in six counties: Canadian (1.078%), Cleveland (1.09%), Canadian (1.084%), Jackson (1.158%), Payne (1.142%), and Pottawatomie (1.009%).
The above map shows the leading political party by county, whether holding a plurality or an outright majority of registered voters. The blue color that once dominated the state has all but completely dissapeared. Democrats are now down to a single county where they hold a slim plurarlity of voters (Coal County). Over the past year, they lost the majority in Coal County, as well as pluralities in six counties.
The GOP has plurality leads in 18 counties, and outright majorities in the remaining 58 counties.
For the second consecutive year, the OKGOP had positive momentum in all 77 counties.
The registration swing is obviously heaviest in the areas that still have more registered Democrats, with southeast and southern Oklahoma in particular continuing rapid shifting to the GOP.
Republicans did slide in raw percentage in four counties, but those losses were offset by steeper Democratic declines. The growth of Independents did outpace Republicans in nine counties (though some by the slimmest of margins).
Republicans are at an all-time high, with 51.88% of registered voters statewide.
Independents did outpace Republicans in growth, increasing from 16.25% of registered voters to 17.18% (+0.924%). In 19 counties, Independent growth beat Republican growth (led by 1.61% in Oklahoma County and 1.63% in Canadian County, for example).
Independents now lead Democrats in Beaver County (+0.03%) and Texas County (+0.4%), and trail Democrats by less than 2% in the following counties: Garfield (-1.25%), Major (-0.14%), Washington (-0.47%), and Wooward (-0.47%).
19.2% of registered voters in Oklahoma are now Independent.


0 comments:
Post a Comment
PLEASE INCLUDE YOUR NAME when commenting. Anonymous comments may be rejected if NOT accompanied by a name.
Comments are welcome, but remember - commenting on my blog is a privilege. Do not abuse that privilege, or your comment will be deleted.
Thank you for joining in the discussion at MuskogeePolitico.com! Your opinion is appreciated!